The Power of ARTIFICIAL Intelligence Applied to Vital Signs
PRECISION IN EVERY PULSE!
VITALNET.AI
Patient Vital Signs are the key to any assessment. They are the most import indicators of patient stability or instability. Often, they are the first, sometime subtle, indication that a disease process is taking hold. Nothing has changed for decades. Until now...
What happens when the power of Artificial Intelligence is applied to Vital Signs?
It starts by capturing the vital signs - this can be done traditionally or with Remote Patient Monitoring. Handwritten vitals can be easily upload with a single picture - including multiple patient vitals on a single sheet (the entire nursing unit). More than a 1000 form types can be read and converted instantly from handwritten logs to digital information using Optical Character Recognition. No need to change your current processes.
Now our Artificial Intelligence engine can analyze the data as you have never seen before. Computers can plot vital signs and identify abnormal values (this has been available for at least 3 decades). However, AI brings this to a completely new level by actually thinking about the vital sign changes and trends. Even creating patient-specific predictive models of expected vital signs before they are even collected.
VitalNet.AI utilizes the provider entered vitals signs (including pain scale 0-10) and then compares it to recreated AI data creating an unbefore seen layer of analysis. Using a complex Mean Square Error computation, VitalNet.AI determines patient specific thresholds and then determines if an anomalous finding exists.
Real-Time alerts are sent to nursing staff and associated providers.
Learn More
If you are interested in learning more about VitalNet.AI or purchasing the software for your organization, please get in touch with me.

One Key Element
The key element to VitalNet.AI's success is invisibility:
No change in how vitals are captured or recorded by your staff. Just a premium quality notification when a patient needs and deserves your attention (recognized before any human or ordinary computer could do so).
How It Works:
1/5
Mean Squared Error (MSE) Calculation
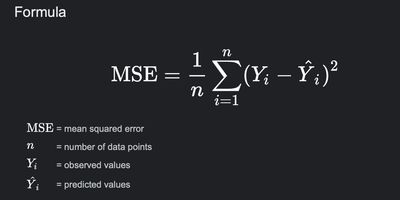
The calculations for the mean squared error are similar to the variance. To find the MSE, take the observed value, subtract the predicted value, and square that difference. Repeat that for all observations. Then, sum all of those squared values and divide by the number of observations.
Notice that the numerator is the sum of the squared errors (SSE), which linear regression minimizes. MSE simply divides the SSE by the sample size.
Mean Square Error (MSE) is used by VitalNet.AI in statistical analysis to measure the average squared difference between the predicted vitals values and the actual values in the dataset. It is a way for VitalNet.AI to quantify the accuracy of a prediction or an estimator.
Mathematically, MSE is calculated as:
MSE = (1/n) * Σ(yi - ŷi)^2
Where:
- MSE is the Mean Square Error.
- n is the total number of data points.
- yi represents the actual values or observations.
- ŷi represents the predicted values or estimates.
Here's how we apply MSE:
1. Prediction Evaluation: It is often used to evaluate the performance of predictive models, such as regression models. Lower MSE values indicate better model performance.
2. Loss Function: In machine learning, MSE can be used as a loss function that the model tries to minimize during training. In this context, it is also known as the "squared error loss."
3. Optimization: MSE is used in optimization algorithms to find the best-fitting parameters for a model. For example, in linear regression, the goal is to find the parameters (coefficients) that minimize the MSE.
4. Outlier Sensitivity: MSE gives more weight to larger errors due to the squaring operation, making it sensitive to outliers. In cases where outliers should be given less importance, other loss functions like Mean Absolute Error (MAE) may be preferred by VitalNet.AI during computational analysis.

Copyright © 2024 Max Diamond, M.D. - All Rights Reserved.